Adapted from content provided by Dimensional Fund Advisors

A top-heavy stock market with the largest 10 stocks accounting for over 20% of market capitalization and a marquee technology firm perched at No. 1? This may sound like a description of the current U.S. stock market, dominated by Apple and the other FAANG stocks (Facebook, Amazon, Apple, Netflix, and Google), but it is actually a reference to 1967, when IBM represented a larger portion of the market than Apple at the end of 2019 (5.8% vs. 4.1%).
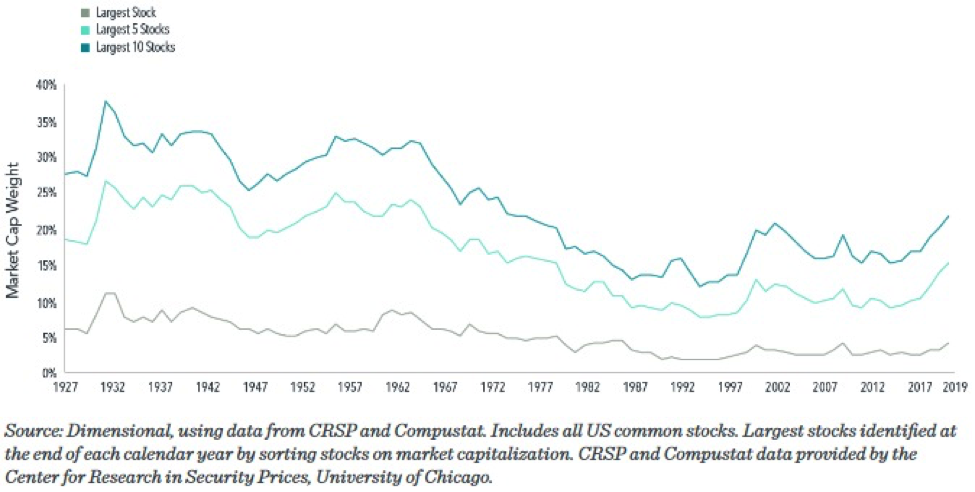
As we see in Exhibit 1, it is not particularly unusual for the market to be concentrated in a handful of stocks. The combined market capitalization weight of the 10 largest stocks, just over 20% at the end of last year, has been even higher in the past.
Exhibit 1
Weight of Largest Stocks as % of Total U.S. Market
A breakdown of the top stocks by decade shows a lot of stability decade to decade, even though (unsurprisingly) there has been a lot of change over 100 years.
Exhibit 2
Largest U.S. Stocks at Start of Decade

From 1930 to 2010, just a handful of stocks (Marathon, Union Carbide, Kodak, Amoco, Altria, and Cisco) only appear in the top 5 once. On the other hand, another small handful (AT&T, GM, GE, and Exxon) occupy 58% of all the top 5 spots between 1930 and 2010. Add just a few more (Dupont, IBM, Microsoft) and you’ve accounted for 70% of the top 5 stocks over one hundred years!
In fact, the top 10 U.S. stocks in any year account for anywhere from 13% to 33% of total U.S. market capitalization. That’s a lot of wealth concentrated in just a few companies.
While the definition of “high-tech” is constantly evolving, firms dominating the market have often been on the cutting edge of technology. AT&T offered the first mobile telephone service in 1946. General Motors pioneered such innovations as the electric car starter, airbags, and automatic transmission. General Electric built upon the original Edison light bulb invention, contributing to further breakthroughs in lighting technology, such as the fluorescent bulb, halogen bulb, and LED.
So technological innovation dominating the stock market is not a new normal; it is a normal normal.
Another trend attributed to a new normal is the extraordinary performance of FAANG stocks over the past decade, leading some to wonder if we should expect these stocks to continue such strong performance going forward.
Investors should remember that any expectations about the future operational performance of a firm are already reflected in its current price. While positive developments for the company that exceed current expectations may lead to further appreciation of its stock price, those unexpected changes are not predictable.
To this point, charting the performance of stocks following the year they joined the list of the 10 largest firms shows decidedly less stratospheric results. On average, these stocks outperformed the market by an annualized 0.7% in the subsequent three-year period. Over five- and 10-year periods, these stocks underperformed the market on average.
Exhibit 3
Annualized Market Premium (return in excess of market return)
For Stocks After Joining 10 Largest U.S. Stocks

The only constant is change, and the more things change the more they stay the same. This seems an apt description of the dominant stocks atop the market.
While the types of businesses most prominent in the market vary through time, the fact that a small subset of companies’ stocks account for an outsized portion of the stock market is not new. And it remains impossible to systematically predict which large companies will outperform the stock market and which will underperform it.
This underscores the importance of having a broadly diversified equity portfolio that provides exposure to a vast array of companies and sectors.